


Let’s imagine three similar scenarios:
- Imagine you are a head of sales and marketing. You are asked, “what is the pipeline looking like?” and say, “we have 100 opportunities and, based on history, 4 per cent will land.”
- Imagine you are planning a digital marketing campaign. You expect to drive 100 visitors to your site and, according to your analytics tool, you expect 4 per cent to convert.
- Imagine you are looking at buying a company and the vendor’s sales director says, “we have 100 hot leads and you can count on 4 of them coming through.”
That all sounds great. All three scenarios are data led and yet, for some reason, the reality often falls short of expectations. In each of these scenarios, someone is going to have to make decisions based on the likelihood of future income.
The consequences of getting a forecast wrong can be significant – small changes in win/loss rates can create enormous commercial issues; especially after a business is acquired, sold or in receipt of growth capital. We all expect to see volatility, but to what extent can variance be objectively predicted with maths alone?
This article looks at the simple mathematical reasons why expectations don’t match reality and suggests how to better understand the data. A very basic application of binomial probability is used to uncover more about the up and down sides of pipeline and probability.
Going back to the three examples, let’s imagine a business has 100 sales opportunities and historically, a 4 per cent long-run average chance of converting an opportunity into a win. The business can only sell an integer (i.e. it can’t sell half a thing). Therefore, you would naturally expect the most likely number of sales to be exactly four.
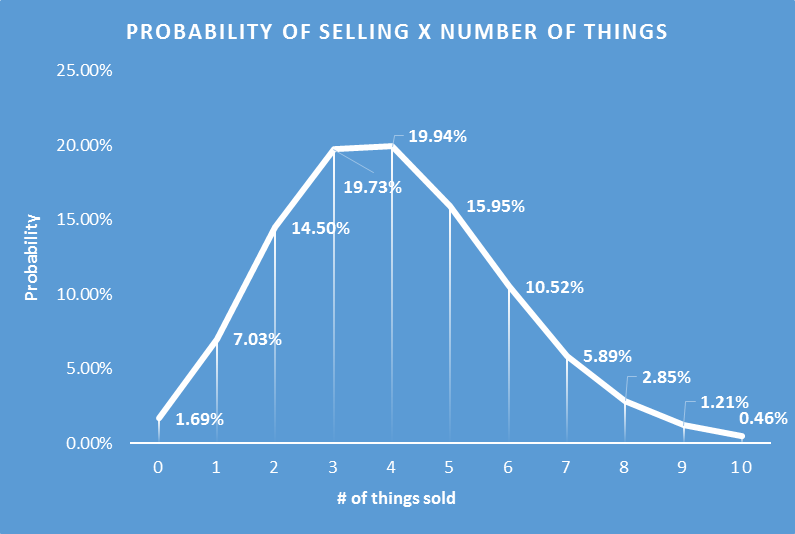
But what is the likelihood of selling between nothing and three things (i.e. the downside to the forecast)? What about the probability of selling five or more things (i.e. the upside of the forecast)? This is powerful information for directors to make decisions with and be connected to. The graph below shows the probability, derived from binomial distribution formulae, of selling zero to ten things with a ‘win’ probability of 4 per cent and 100 sales opportunities:
Some simple conclusions from this are:
- It is most likely that you will sell four things – this is quite intuitive given the 4 per cent win probability;
- But, there is actually only a 19.94 per cent chance that you will sell four things;
- And, in fact, it is only fractionally less likely (by a mere 0.21 per cent) that you will sell three things, and;
- There is a 42.95 per cent chance you will sell zero to three things.
This is quite worrying. Yes, four sales is the most likely outcome (just), but the probability of getting between zero and three sales is high and, in our experience, rarely calculated, recognised, considered, debated or communicated.
The key question is, if the sales person, digital marketer, acquirer, consultant or corporate financier knew there was only a c20 per cent chance that the business would sell four things, what would they and, by extension, the leadership team do differently? It is not hard to imagine that confidence would change and that the firm’s strategy, resource allocation and targeting plan would consequently adjust on reflection of the risks around selling less than four things.
Notwithstanding specific insight on certain opportunities within the pipeline, there is also a tacit assumption in here that all opportunities are equally valuable which normally isn’t true. However, segmenting pipeline by commonality (e.g. defining the 100 as “100 opportunities of £2 million to £2.5 million each in value”) is a simple way through this. There is also no need to have a sample as high as 100 to get value from applying binomial distribution probabilities – the maths is equally valuable for samples as small as 10.
It is also true that, sometimes, discounting the forecast happens intuitively; for instance, a sales person might say, “we’re in for £2 million this month but, let’s call it £1.5 million.” There are three issues with this intuitive approach to adjusting for risk. Firstly, why should the owners discount equity value (which normally relies on forecast income) because of an un-quantified gut feel? Secondly, how can a finance director really use that crude an approach to then make targeted, specific decisions to support sales and marketing efforts and focus resources around the drivers of up and downside risk? Thirdly, if you are going to discount the forecast, why not actually run the numbers and talk to senior leaders and investors about the logic first so everyone is on the same page and understands the logic and specific consequences?
Conclusions
The solution to the dilemmas described above is to model the numbers and have a more informed discussion with senior leadership. There are four conclusions to take away:
- Learning how to do this analysis is simple and quick but the value is immense as, fundamentally, you are quantifying the upside and downside of your pipeline and marketing campaigns.
- The real power of this is in informing conversations with senior decision makers, adjusting strategy, managing sales and marketing teams and reallocating resources. Once you can locate and measure risk and opportunity you can act with precision.
- This is a great way to get comfortable with an acquisition target’s sales pipeline. These calculations might inform changes to the deal structure, or, potentially even the value of the firm.
- Make sure that any agency, consultant or potential employee who claims to deliver “data led [enter generic adjective here]” gets grilled on their true substance. Our experience is that many have a limited ability to really understand commercial data analytics or use a blank sheet and their own critical thinking skills. In particular be wary of the reliance on generic tools/applications that are really just doing simple maths on CRM data, website traffic or social media.
I appreciate that I haven’t put the formula in here – it can be easily found online and is relatively straight forward; it can also be simplified far beyond what you see on Wikipedia etc to be calculated quickly. The theory is also known as a ‘Bernoulli trial,’ developed by the 17th century Swiss mathematician, Jacob. He and his family have a fascinating history in mathematics and physics and are well worth a quick Google. As always, the real value is in knowing how to apply this stuff to the real world so please reach out if you have any questions.
Chand Chudasama is the strategic corporate finance manager at Price Bailey LLP.